


Real Trading Performance, The Honest Version
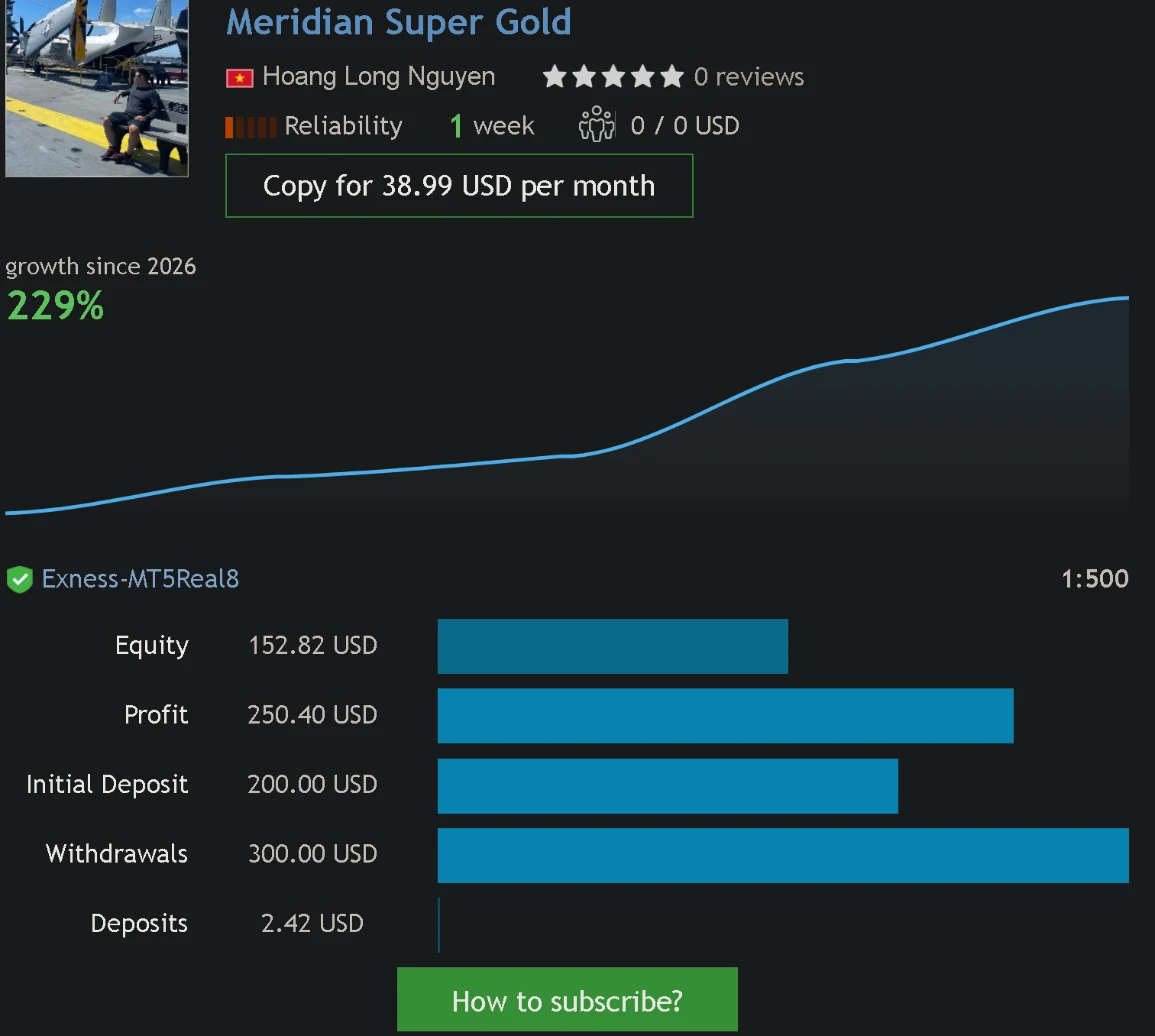
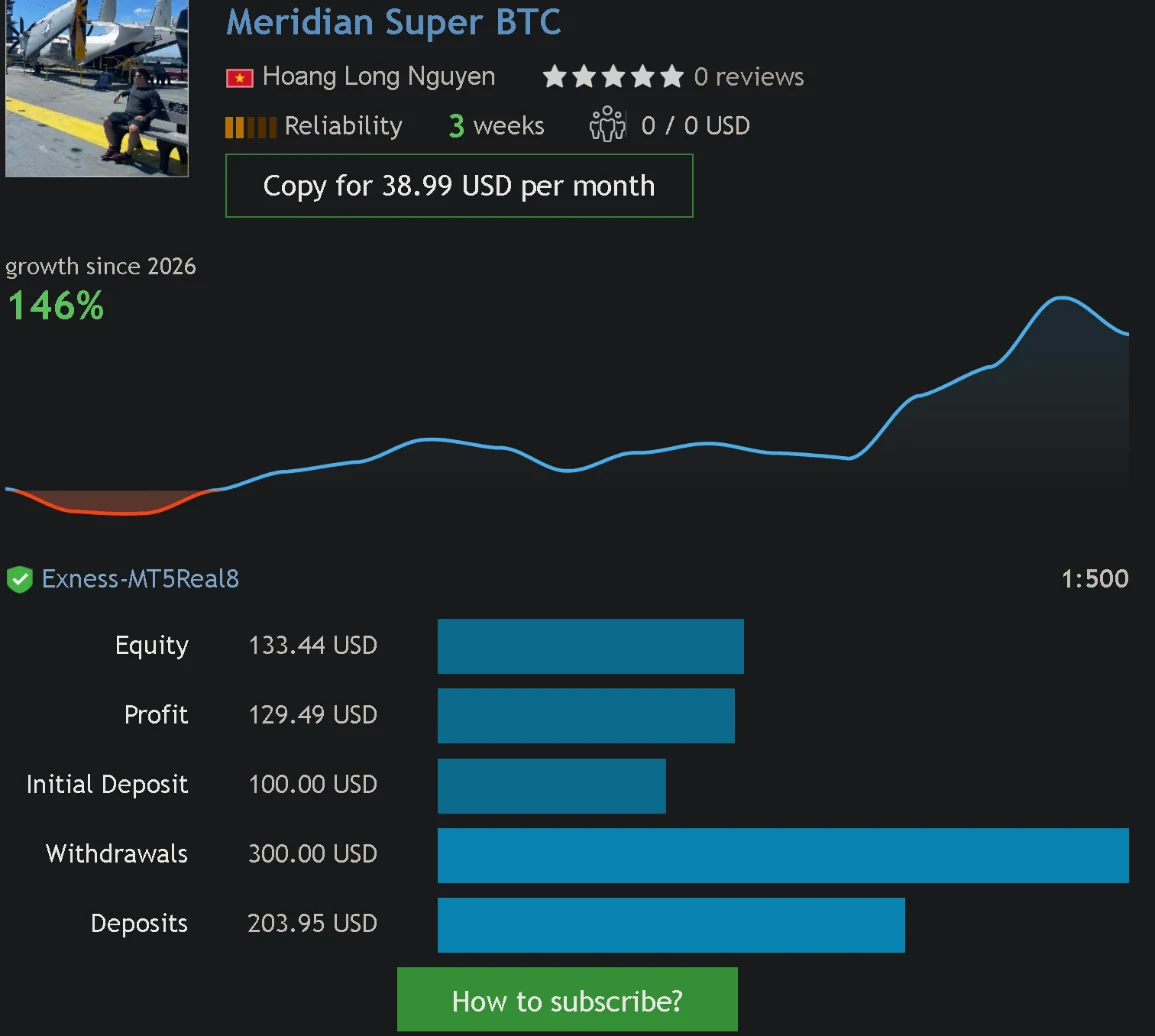
Both bots trade on real money accounts, independently tracked in public by MQL5's Signals service. Here is everything that shows, including the fact that the track record is still very young.
Both accounts run on Exness MT5 Real, and the figures below come directly from the public MQL5 signal pages linked under each bot. Nothing here is edited or hand picked. Open either signal yourself to watch the same numbers update in real time.
Live account figures
Growth percent is shown for completeness, but with only a few days of history it says little on its own. Profit factor, drawdown and the number of closed trades give a fuller picture of how each account actually traded.
Meridian Super Gold
Meridian Super BTC
What these figures do, and do not, tell you
- The track record is short. A few days of live trading can look very different from a few months. Treat everything on this page as an early read, not a proven result.
- Growth percent is cumulative, not annual. It is the total return on that signal's own starting deposit since it began, not a yearly rate and not a promise of future performance.
- Drawdown is the real risk taken. The equity and balance drawdown figures show how far each account fell from a peak before recovering. High growth alongside high drawdown means real risk sat behind the returns.
- Your own results will differ. These signal accounts trade their own lot size and starting balance. Running MeridianSuperGold or MeridianSuperBTC yourself depends on your own lot size, account balance, broker conditions and when you start.
- This page is updated by hand. This site runs no scripts, so the figures and screenshots here are a snapshot captured on 30 September 2026. For the live, constantly updating numbers, use the View Live Signal links above.
Automated trading carries risk whatever its recent track record shows. Please read the risk disclosure before using either bot.
Ready to automate your trading?
Choose your bot and your plan. Your License Key arrives by email as soon as your payment is confirmed.